Know the money
Know exactly what your property earns
Not revenue. Profit — after every expense and every salary.
Most hotel software tells you what came in. Almost none tells you what you kept.
So month-end becomes a ritual: bookings exported from one place, expenses added up from a folder, salaries from a third file, and an answer that arrives two weeks late and that nobody entirely trusts. The decisions that depend on it — whether to discount, whether to hire, whether the restaurant is actually earning — get made on instinct instead.
Analytics & net profit is one of the modules included in the MangoHost platform — every plan has all of them, so nothing on this page is an upsell.
The workflow
How it works
Profit, calculated
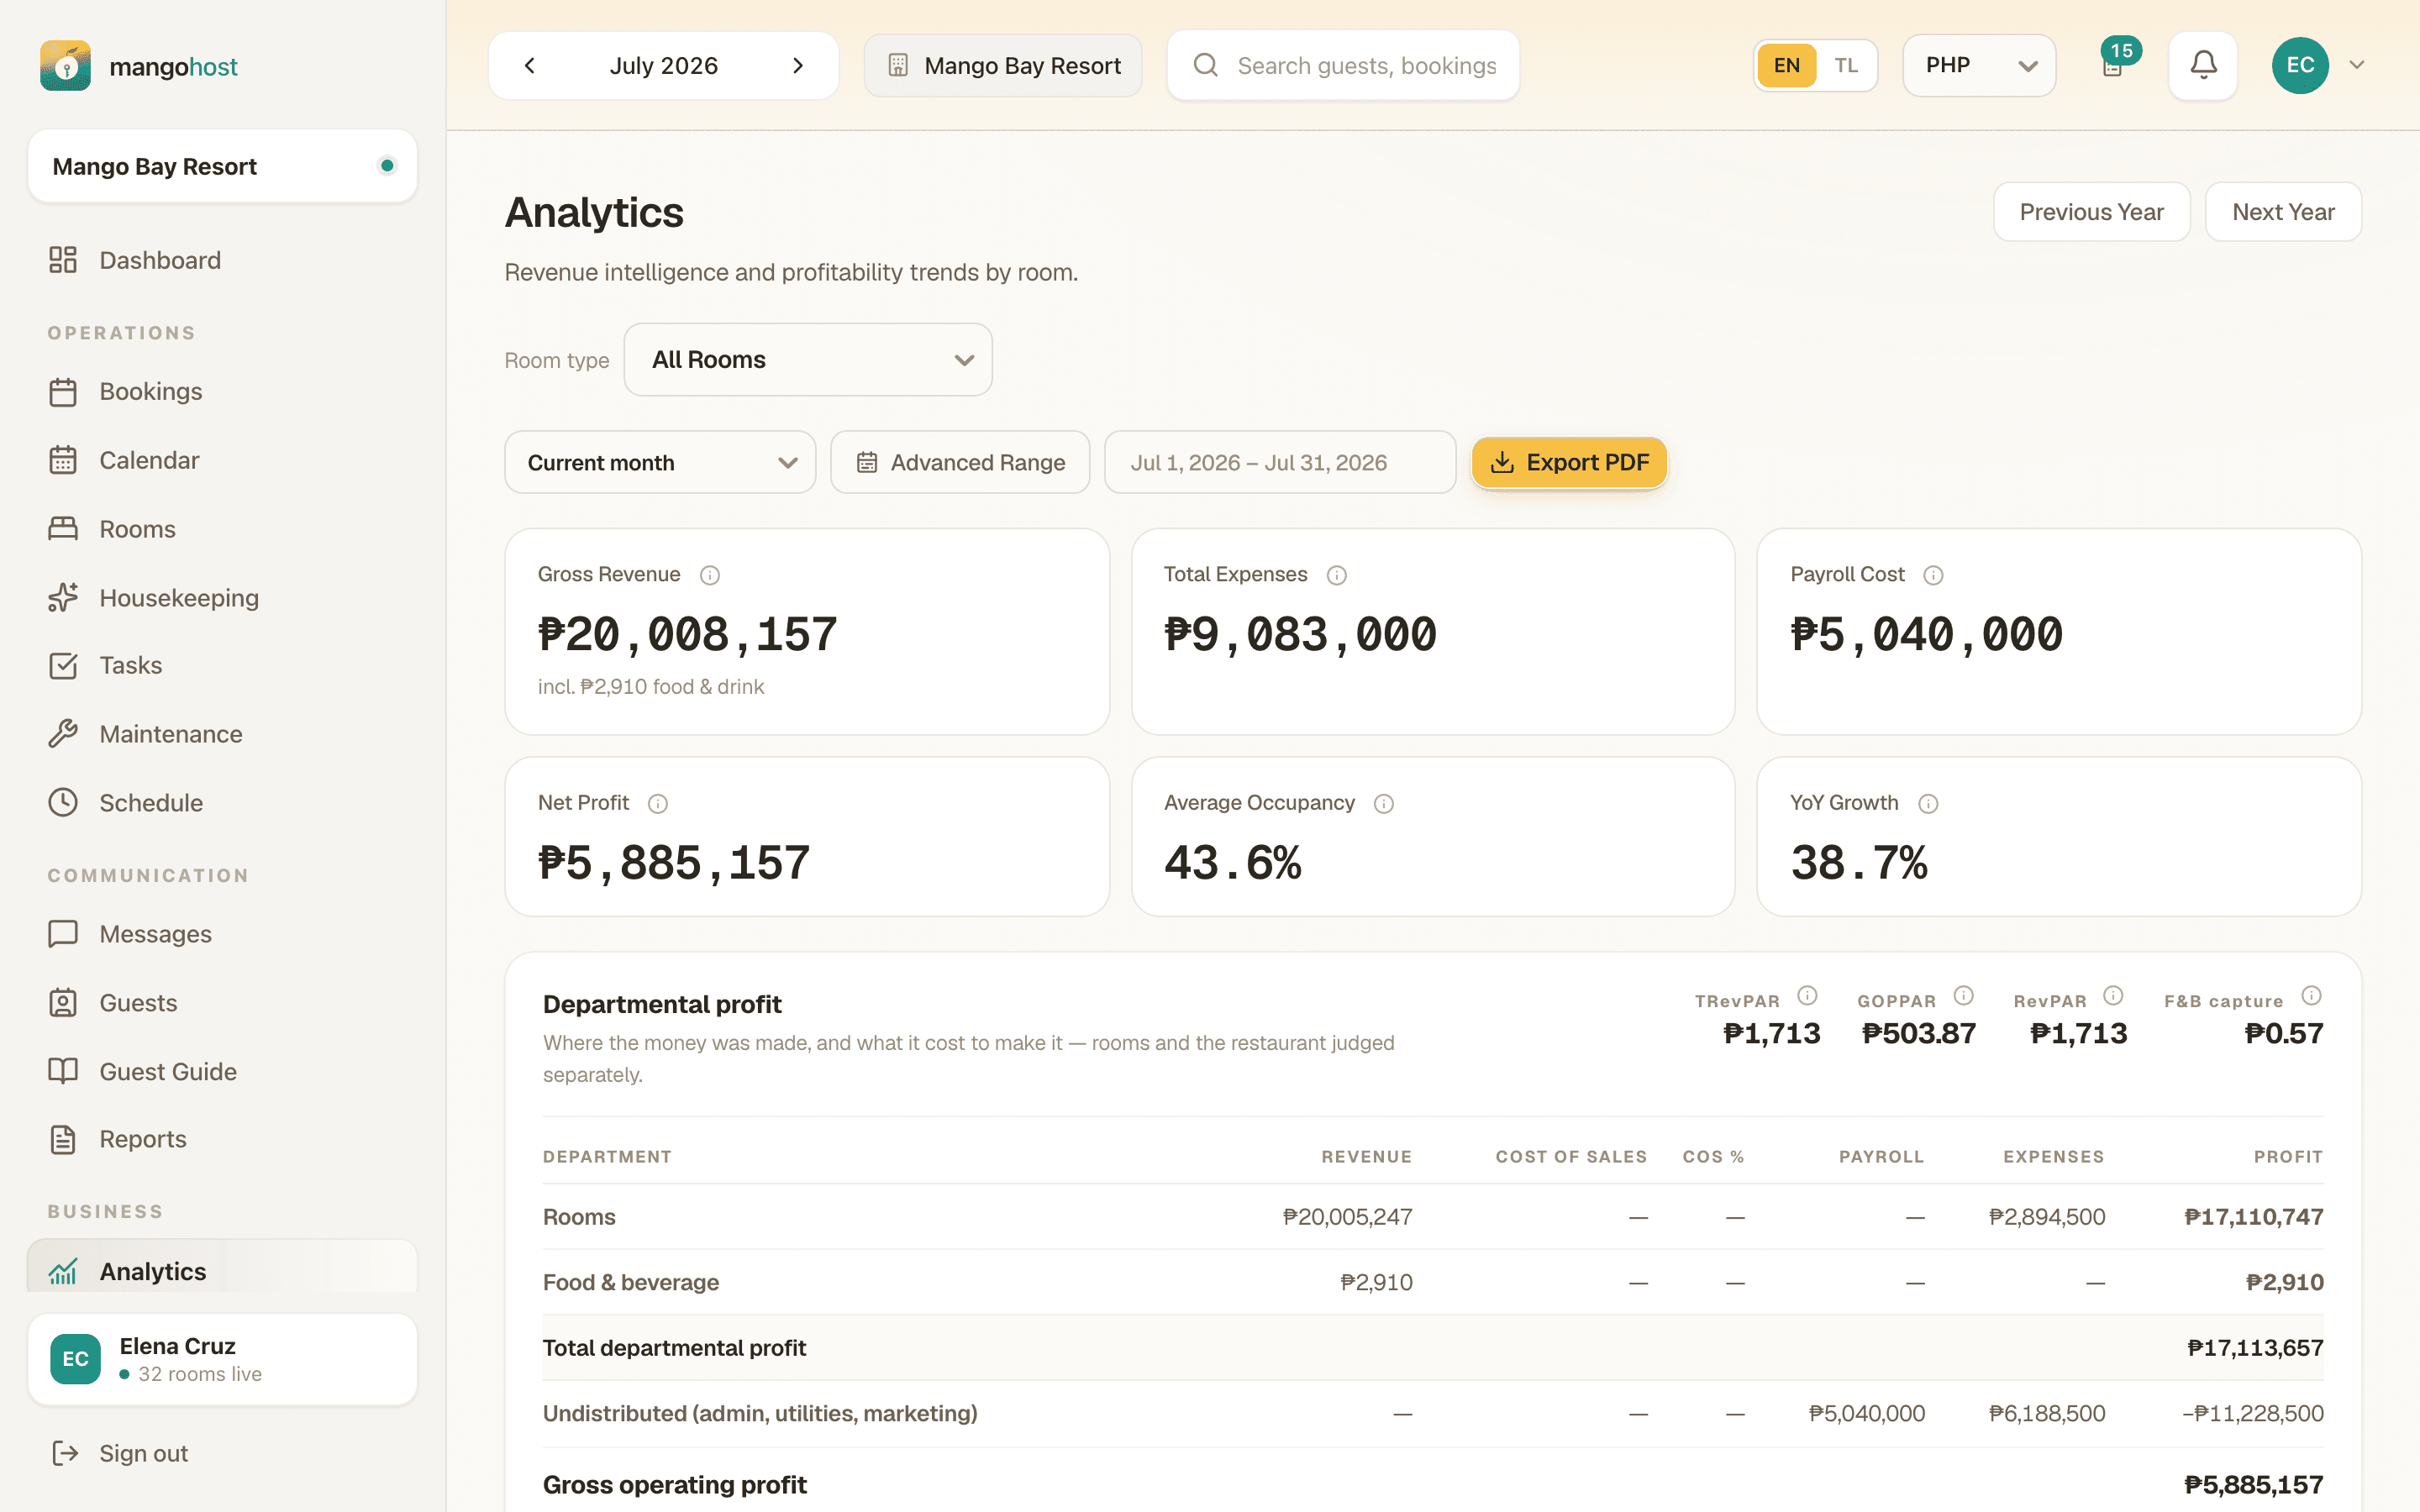
Gross revenue, minus your expenses, minus payroll, equals net profit and margin. It updates as the month goes, because the bookings, the expenses and the salaries are already in the same system — there is nothing to reconcile.
Restaurant takings join the same figure without disturbing your room metrics: food and drink revenue is deliberately kept out of the per-night maths, so occupancy and average rate cannot drift because a guest bought a beer.
The metrics hotels are judged on
Occupancy, average daily rate, revenue per available room, and year-on-year growth — for the month, for the year, and filtered to a single room when you want to know which ones actually pay.
- Occupancy — nights sold against nights available
- ADR — what the average sold night earned
- RevPAR — what the average room earned, sold or not
- TRevPAR and GOPPAR, once the restaurant is in play
Where the money went
A monthly profit-and-loss chart, occupancy by month, revenue by month, and an expense breakdown by category. Enough to see the shape of a year and the reason a bad month was bad.
Revenue counted when the money arrived
A booking made in March for a stay in May, with a downpayment in March and the balance at check-out in May, is not March revenue and it is not May revenue. It is both, split the way the money actually moved.
MangoHost recognises revenue on a cash basis: each payment lands in the month it was confirmed, and a refund books as a negative in the month it was handed back. Bookings with no payment ledger — legacy rows, imported reservations — fall back to spreading across the nights, so your historical figures do not collapse to zero the day you switch.
The per-night metrics are held separately from this on purpose. ADR and RevPAR are rates, so they are priced off what the nights sold in a month are worth, not off cash collected — otherwise a large downpayment would make a quiet month look like a record.
Rooms and the restaurant, judged separately
If you run food and drink, one blended profit number hides the question you actually have: which half is carrying the other. The departmental view splits revenue, cost of sales, payroll and expenses by department, gives each its own profit line, and then totals them.
Above it sit the two ratios that let you compare yourself to a real hotel rather than to last month: TRevPAR — total revenue per available room, including F&B — and GOPPAR, gross operating profit per available room.
A report you can send an owner
One click produces a PDF for any date range. If the person who owns the property is not the person running it — an owner in Manila, a resort in Puerto Galera — that report is the whole relationship, and it should not cost anyone an afternoon.
The same export covers a month, a quarter, a season, or the run of dates a lender asked about.
In detail
| KPI cards | Gross revenue, total expenses, payroll cost, net profit, average occupancy, year-on-year growth. |
|---|---|
| Departmental profit | Rooms and the restaurant judged separately, then together. |
| Occupancy chart | Monthly, with booked and available nights in the tooltip. |
| Revenue and P&L charts | Monthly revenue and profit-and-loss. |
| Expense breakdown | By category, for the period. |
| Per-room filter | Every figure scoped to one room. |
| Cash-basis recognition | Revenue lands in the month the payment was confirmed, not the month the booking was made. |
| PDF export | Owner report for any date range. |
| Unit-tested engine | The calculation has a test suite. In a market of spreadsheet-grade tools, that is unusual — and checkable. |
Who this is for
You own the property but do not run it day to day
The PDF owner report and the live profit figure are the two things that replace a phone call and a promise.
You are deciding whether to discount
RevPAR and margin together tell you whether a cheaper room-night was worth selling. Occupancy alone never does.
See it on your own property
Thirty minutes with the IslandLink team, your rooms and your rates. No card, nothing to sign.